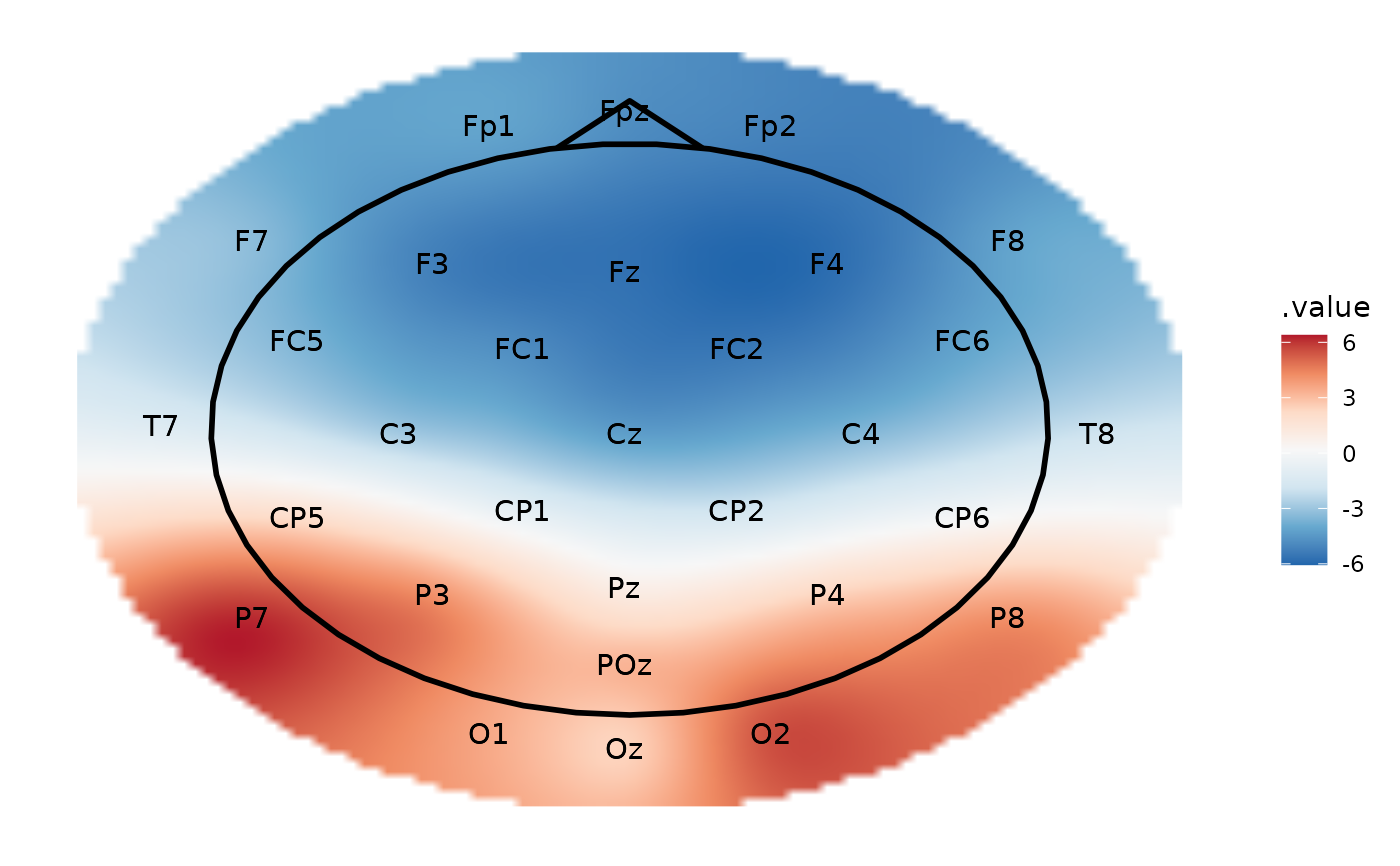
Adds the outline of a head and nose to a ggplot.
annotate_head(size = 1.1, color = "black", stroke = 1)Arguments
- size
Size of the head
- color
Color of the head
- stroke
Line thickness
Value
A layer for a ggplot
See also
Other plotting functions:
annotate_electrodes(),
annotate_events(),
eeg_downsample(),
ggplot.eeg_lst(),
plot.eeg_lst(),
plot_components(),
plot_in_layout(),
plot_topo(),
theme_eeguana()
Examples
library(ggplot2)
data_faces_ERPs %>%
  eeg_filter(between(as_time(.sample, .unit = "milliseconds"), 100, 200)) %>%
  eeg_group_by(condition) %>%
  eeg_summarize(across_ch(mean, na.rm = TRUE)) %>%
  plot_topo() +
  annotate_head(size = .9, color = "black", stroke = 1) +
  annotate_electrodes()